Pearson Edexcel · A-Level · Economics B
Course version: 9EB0 · Version from Sept 2015
Quantitative skills: QS 3: understand and use the terms mean, median and…
Full specification wording
Appendix 3: Quantitative skills: QS 3: understand and use the terms mean, median and relevant quantiles
In economics, measures of central tendency and spread are vital for analysing data such as income distribution.
Checked against the Pearson Edexcel 9EB0 specification (opens in a new tab) on .
- Point 3 of 7
Study notes
From the checked teaching notes for this specification point.
The idea
In economics, measures of central tendency and spread are vital for analysing data such as income distribution. The mean is the mathematical average, calculated by summing all values and dividing by the number of observations. For example, total national income divided by population gives the mean income. The median is the middle value when data is ordered sequentially, which is often more representative for skewed data like wages, as it is unaffected by extreme outliers. Quantiles divide an ordered dataset into equal parts. Relevant quantiles include quartiles (four parts), deciles (ten parts), and percentiles (one hundred parts). Economists frequently use the top quartile or the 90th percentile to analyse wealth inequality.
What earns the marks
- Identify the correct formula or method for calculating the mean from a given dataset.
- Determine the median by correctly ordering the dataset and locating the central value.
- Calculate specific quantiles, such as the lower or upper quartile, from a set of economic data.
- Interpret the difference between the mean and median to draw conclusions about data skewness, such as income inequality.
Common mistakes and how to put them right
Calculating the median without first ordering the data from lowest to highest.
Put it right: Sort the dataset sequentially before identifying the middle value.
Confusing quartiles with percentiles, such as assuming the 4th quartile is the 4th percentile.
Put it right: Quartiles divide data into four 25% segments, whereas percentiles divide it into one hundred 1% segments.
Using the mean instead of the median to represent typical values in highly skewed economic data.
Put it right: Select the median for skewed data, as extreme outliers disproportionately distort the mean.
Exam tips
- When calculating the median for an even number of observations, find the mean of the two central values.
- Use quantiles to support evaluative arguments about inequality, such as comparing the income of the top decile to the bottom decile.
- Always double-check your addition when summing large numbers for a mean calculation to avoid simple arithmetic errors.
Try the lesson
The start of the Appendix 3: Quantitative skills: QS 3: understand and use the terms mean, median and relevant quantiles lesson, made from checked teaching notes for this specification point.
Have a go first
A small business records its daily profit over a seven-day period as follows: £100, £120, £140, £150, £180, £200, £300. What is the median daily profit?
Listen
In economics, measures of central tendency and spread are vital for analysing data such as income distribution. The mean is the mathematical average, calculated by summing all values and dividing by the number of observations. For example, total national income divided by population gives the mean income. The median is the middle value when data is ordered sequentially, which is often more representative for skewed data like wages, as it is unaffected by extreme outliers. Quantiles divide an ordered dataset into equal parts. Relevant quantiles include quartiles (four parts), deciles (ten parts), and percentiles (one hundred parts). Economists frequently use the top quartile or the 90th percentile to analyse wealth inequality. A strong answer earns marks for these points. Identify the correct formula or method for calculating the mean from a given dataset. Determine the median by correctly ordering the dataset and locating the central value. Calculate specific quantiles, such as the lower or upper quartile, from a set of economic data. Interpret the difference between the mean and median to draw conclusions about data skewness, such as income inequality. A common slip: Calculating the median without first ordering the data from lowest to highest. Instead, sort the dataset sequentially before identifying the middle value. Exam tip: When calculating the median for an even number of observations, find the mean of the two central values.
See it
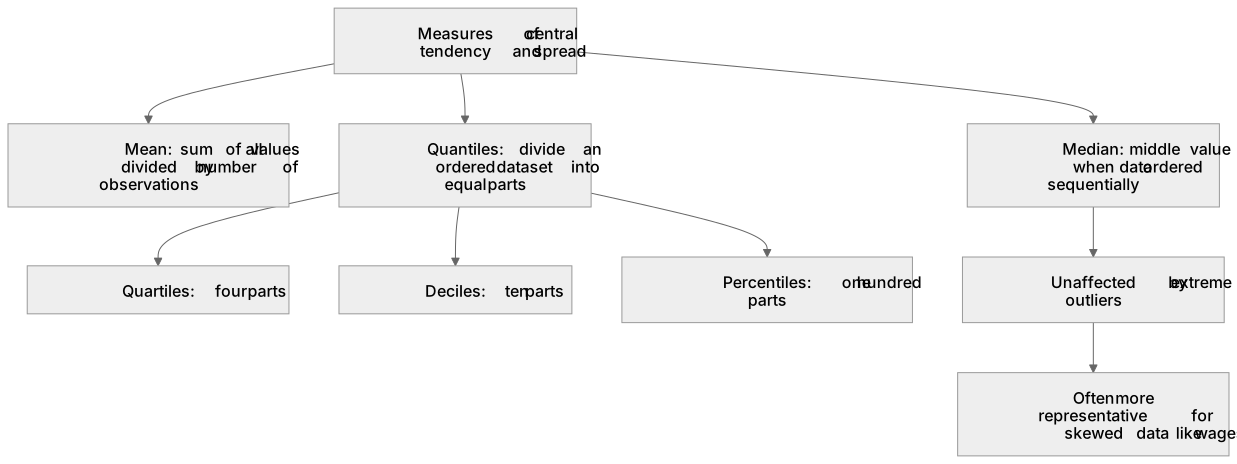
Label the diagram
Some boxes have lost their names. Pick the right name for each number.
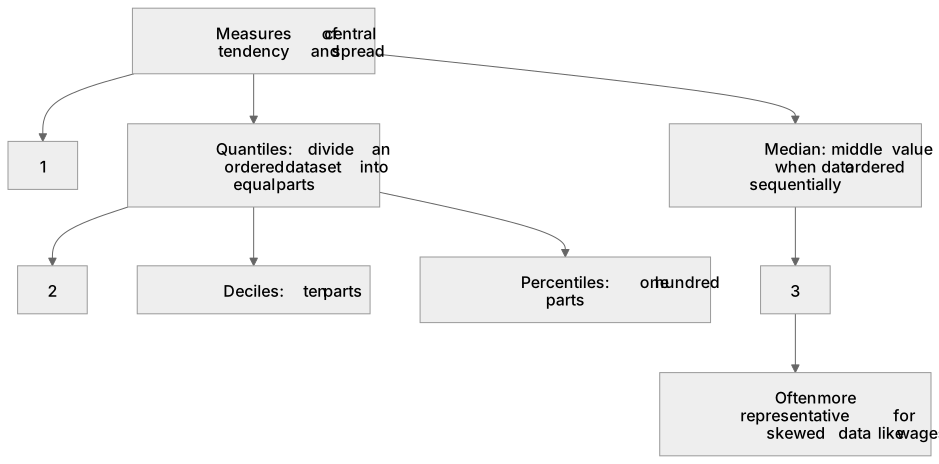
1Box 1
2Box 2
3Box 3
There is more to this lesson
The full lesson goes on to check your understanding and help you earn the marks. Create a free account to carry on, with your progress saved.
A week of Premium from your first lesson · Then the free plan continues · No card, no charge
Test your understanding of Appendix 3: Quantitative skills: QS 3: understand and use the terms mean, median and relevant quantiles
Active recall beats re-reading. Take an instant quiz now to test what you’ve learned and lock it into long-term memory.
A week of Premium from your first lesson · Then the free plan continues · No card, no charge